")
by James Lewis
The fear of missing out (FOMO) is the anxiety a person feels when missing out on opportunities they perceive that others are experiencing. Whether it involves trying to get tickets to Taylor Swift: The Eras Tour or keeping up with the latest trends posted on social media outlets (think Facebook, Instagram and Twitter) most of us have likely experienced FOMO to some degree.
When it comes to investing, I have seen how FOMO can easily tempt a would-be disciplined investor to modify their long-term investment strategy in exchange for their emotions pushing them to ‘hit a home run’. And who would blame them? Afterall, there is no shortage of media outlets, advisory firms, and spam emails promoting a myriad of investment styles including indexing, active, passive, growth, size, quality, value, market capitalization …the road goes on forever.
And while the allure of changing styles based on the current flavor-of-the-day (week, month or year) can seem quite lucrative, implementing this approach relies heavily on timing. And therein lies the issue. Anyone can get lucky. And when someone does, we almost always hear about it. But we rarely hear about it when it goes the other way. No one brags about their investment blunders.
So, I challenged myself to take a deep dive into the age-old debate of investment performance; is it better to adhere to a specific investment style (consistency) versus trying to time the market (chasing returns). To assist with this task, I enlisted my colleague and co-worker, Connor Miller (Co-Chief Investment Officer at Capital Investment Advisors).
For this exercise we gathered the total return data on six (6) different indices which track and benchmark better-known and more frequently utilized styles of investing:
1. S&P 500: Investing in a portfolio of companies that mirrors the S&P 500 index.
2. Value: Investing in companies with lower valuations relative to their peers (Russell 1000 Value Index).
3. Growth: Investing in companies that are expected to grow at an above-average rate relative to the market (Russell 1000 Growth Index).
4. Quality: Investing in companies with strong financials (fundamentals) and are more efficient with their capital relative to their peers. (MSCI USA Quality Index)
5. Minimum Volatility (Min Vol): Investing in portfolio of companies that have exhibit lower volatility relative to the market. (MSCI USA Minimum Volatility Index)
6. Momentum: Investing in companies based on their recent market trends by overweighting/underweighting holdings based on technical indicators. (MSCI USA Momentum Index)
Why evaluate 6 different styles?
Because there is more than one way to invest, certainly more than these six. Whatever style or strategy is right for you depends on you and your appetite for risk, your investment horizon, if you are a do-it-yourselfer, or working with a trusted financial advisor.
And the purpose of this article is not to say in absolute terms that one investment style is better than the other. It all has to do with selecting a style that best resonates with you and more importantly your overall plan and goals. And yes, your style can certainly change based on where you are in your stage of life.
Generally speaking, when we are working and saving (socking money away into our retirement accounts) we are focused on accumulation and growth. After all, most of us probably don’t want to work forever. At some point we would like to retire. And again, generally speaking, once we are at or near retirement our sentiment may shift to preservation and income. The trick in all of this is knowing where you are and what you are trying to accomplish as opposed to falling into the trap of chasing returns.
Let’s delve into the data and get to the point.
The table below summarizes 23 full calendar years of total return data from 2000 to 2022. The 2023 data is through September 29, 2023.
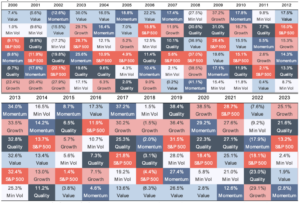
Source: Bloomberg 12/31/1999 – 9/29/2023. S&P 500: S&P 500 Index (SPX Index). Value: Russell 1000 Value (RLV Index). Growth: Russell 1000 Growth (RLG Index). Quality: MSCI USA Quality (M1USQU Index). Min Vol: MSCI USA Minimum Volatility (MXUSMVOL Index). Momentum: MSCI USA Momentum (M1USMMT Index).
The first key takeaway from this color-coded table is that not one of the 6 individual styles was the consistent ‘best’ or ‘worst’ performer on an annual basis.

One might assume, based on the table above, that a Value investor had the best overall performance with 8 years of being the best performer. Or perhaps the worst overall performance, with 7 years of being the worst performer. And they would be wrong on both counts. So, we ranked each style by annualized return.
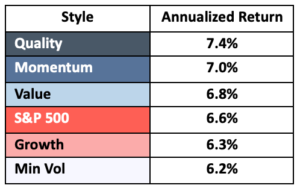
Which brings us to the second key takeaway, choosing an investment style based on the occurrence of best (or worst) annual performance is not necessarily correlated with overall long-term performance.
Now you might be looking at these percentages above and saying, “So what?”. Even the worst style in this dataset (Min Vol) averaged 6.2% per year compared to the best style (Quality) at 7.4% per year. That’s not that big of a difference. Right?
Well let’s put it in context of dollars with an example. Let’s say there are 6 different theoretical investors and each pick a style starting in the year 2000 (12/31/1999)…Quality Quinn, Momentum Mary, Value Victor, S&P Sam, Growth Gary and Min Vol Minnie. Each one of them chooses to invest $500,000 in their equity style which they hold the entire time reinvesting dividends along the way. The table below shows where they each stand as of September 29, 2023, relative to their initial principal investment.
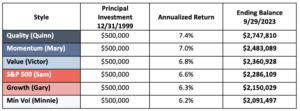
Source: Capital Investment Advisors
Hence the third key takeaway, compounding over time is nothing to sneeze at. The difference in the average annual rate of return between Quality (Quinn) and Min Vol (Minnie) is only 1.2% per year. But over 23 years + 9 months, that compounded 1.2% on a principal investment of $500,000 is a difference of just over $656,300.
But as I stated earlier, the purpose of this article is not to say in absolute terms that one investment style is better than the other. It is about being consistent and true to your style as opposed to chasing returns.
To make the point, I will introduce a 7th hypothetical investor into this mix, FOMO Freddy. Fomo Freddy isn’t sure where to begin in 2000. So, he chooses to invest his initial $500,000 in the S&P 500. That feels like a logical place to start. But after the first year he is down (9.1%). Freddy sees a headline that in 2000 Value was the best performer. So, he changes styles for 2001, from S&P 500 to Value. Value just happens to be the best performer at the end of 2001, so he sticks with it for 2002. But at the end of 2002 he learns Momentum was the top performer. So, he changes styles for 2003 from Value to Momentum. You get the idea. FOMO Freddy changes styles almost every year based on what style had the best performance in the previous year. So where is Freddy as of September 29, 2023, relative to the other 6 investors?
Dead last.
He averaged 5.5% per year with an ending balance of $1,766,750.
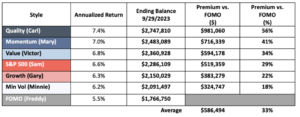
Source: Capital Investment Advisors
Now don’t get me wrong. In isolation, Freddy did just fine. He more than tripled his initial equity position. But the point of this example is that the fear of missing out on better returns hurt him, it didn’t help him. If he had just stuck with his original style (S&P 500) and rebalanced annually (like S&P Sam), he would have done 29% (or $519,359) better than chasing returns based on this dataset.
Bottom Line
I am not advocating that one certain style of investing is better than another. What I am advocating for is consistency. Whatever your style is, have the discipline to stick with it. Especially when your style underperforms, which as you can see from this dataset, is more the norm than the exception. The top annual performer changed 21 times out of the 24 periods. That means on an annual basis the top performing style changed almost 90% of the time (87.5%). And while past performance is not indicative of future results when considering an investment style, I will simply reiterate that this study represents over 23 years of data and can use history to serve as a guide. And that the best overall performing style in this study (Quality), was the best annual performer only once (in 2019) and the worst annual performer only twice (in 2005 & 2014).
Key Takeaways
- No style was the consistent ‘best’ or ‘worst’ performer on an annual basis over the 24 periods considered.
- Choosing an investment style based on the frequency of best (or worst) annual performance is not necessarily correlated with overall performance.
- The power of compounding, in my opinion, is one of an investor’s greatest allies.
- It’s not about picking the best style year over year, rather it’s about consistency.
This information is provided to you as a resource for informational purposes only and is not to be viewed as investment advice or recommendations. Investing involves risk, including the possible loss of principal. There is no guarantee offered that investment return, yield, or performance will be achieved. Stock prices fluctuate, sometimes rapidly and dramatically, due to factors affecting individual companies, particular industries or sectors, or general market conditions. For stocks paying dividends, dividends are not guaranteed, and can increase, decrease, or be eliminated without notice. Fixed-income securities involve interest rate, credit, inflation, and reinvestment risks, and possible loss of principal. As interest rates rise, the value of fixed-income securities falls. Past performance is not indicative of future results when considering any investment vehicle. This information is being presented without consideration of the investment objectives, risk tolerance, or financial circumstances of any specific investor and might not be suitable for all investors. There are many aspects and criteria that must be examined and considered before investing. Investment decisions should not be made solely based on information contained in this article. This information is not intended to, and should not, form a primary basis for any investment decision that you may make. Always consult your own legal, tax, or investment advisor before making any investment/tax/estate/financial planning considerations or decisions. The information contained in the article is strictly an opinion and it is not known whether the strategies will be successful. The views and opinions expressed are for educational purposes only as of the date of production/writing and may change without notice at any time based on numerous factors, such as market or other conditions,